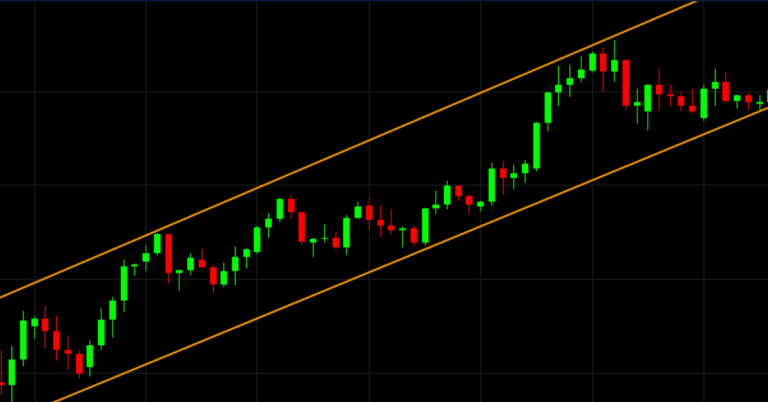
The 52-week range of a stock, which is the range between its highest and lowest prices over the past 52 weeks, is an important metric for investors and traders. It provides valuable information about the stock’s historical performance and price volatility. Here’s why the 52-week range is considered important:
- Price Range Context: The 52-week range gives you a sense of the high and low price extremes that the stock has experienced over the past year. This context is essential for understanding whether the stock is currently trading near its high, low, or somewhere in between.
- Support and Resistance Levels: The range’s high and low points can act as potential support and resistance levels. If the stock approaches its 52-week high, it might encounter resistance as some investors consider it a good opportunity to sell. Conversely, if the stock approaches its 52-week low, it might find support from investors seeing it as a buying opportunity.
- Trends and Momentum: Analyzing where the stock’s current price falls within its 52-week range can help you identify trends and momentum. If the stock is trading near its 52-week high, it might indicate positive momentum. Conversely, if it’s trading near its 52-week low, it might signal negative sentiment.
- Volatility Assessment: The wider the 52-week range, the more volatile the stock’s price has been over the past year. High volatility can indicate larger price swings and potentially higher risk.
- Entry and Exit Points: Traders often use the 52-week range to identify potential entry and exit points. For example, a trader might consider buying if the stock is near its 52-week low and selling if it’s approaching the 52-week high.
- Comparison to Market: Comparing a stock’s current price to its 52-week range can help you assess how it has performed relative to the broader market. If a stock is outperforming the market by consistently trading near its 52-week high, it might indicate strong performance.
- Long-Term Analysis: Investors looking for long-term trends can use the 52-week range to understand the stock’s overall trajectory. This can be particularly useful when evaluating potential investments for portfolio inclusion.
Trading Strategies with 52W range
Trading strategies based on 52-week information typically involve using a stock’s 52-week high and low prices or other related indicators to make trading decisions. Here are a few strategies that traders often employ:
- Breakout Strategy:
- In this strategy, you look for stocks that have recently broken out of their 52-week high price. This may signal upward momentum and the potential for further price appreciation.
- Buy when the stock breaks above its 52-week high and set a stop-loss order below this level to manage risk.
- The idea is to ride the momentum and potentially capture profits as the stock continues to move higher.
- Reversal Strategy:
- A reversal strategy involves looking for stocks that have recently hit their 52-week low price. This could indicate that the stock is oversold and due for a rebound.
- Buy when the stock starts to recover from its 52-week low, with the expectation that it will bounce back.
- Use technical indicators like moving averages or RSI (Relative Strength Index) to confirm the reversal signal.
- Mean Reversion Strategy:
- In a mean reversion strategy, you expect a stock that has moved significantly away from its 52-week average (either high or low) to revert back to the mean.
- Buy when the stock is trading well below its 52-week high but has historically traded at higher levels.
- Sell when the stock is trading significantly above its 52-week low but has historically traded lower.
- This strategy relies on the assumption that prices tend to return to their historical averages over time.
- Volatility-Based Strategy:
- Some traders use the 52-week range to assess a stock’s volatility.
- If a stock is near its 52-week high and has exhibited relatively low volatility within that range, it may be considered a stable, long-term investment.
- Conversely, if a stock is trading closer to its 52-week low and has experienced high volatility, it may be seen as a speculative, short-term opportunity.
- Trend Following Strategy:
- Traders employing this strategy may use the 52-week high or low as a reference point to determine the prevailing trend.
- If a stock is consistently making new 52-week highs, it may be in an uptrend, and traders may look for opportunities to buy on pullbacks.
- If a stock is consistently making new 52-week lows, it may be in a downtrend, and traders may look for opportunities to sell or short-sell on rallies.
- Risk Management:
- Regardless of the strategy, risk management is crucial. Use stop-loss orders to limit potential losses.
- Consider position sizing to ensure that you don’t risk too much of your capital on a single trade.
- Diversify your portfolio to reduce risk, especially when trading stocks with high volatility.
It’s important to note that while the 52-week range provides useful insights, it shouldn’t be the sole factor in your investment decisions. Other factors such as company fundamentals, industry trends, market conditions, and economic data also play significant roles in determining the attractiveness of an investment. Finally, remember that past price performance is not indicative of future results, so no strategy can guarantee profits, and trading involves inherent risks. Always conduct thorough research and consider a variety of information sources before making investment decisions.


