Support and resistance levels are crucial concepts in technical analysis used by traders to make informed decisions about buying and selling assets.
Support and Resistance Level
- Support Level: Support level is a price level where a downtrend is expected to pause or reverse due to a concentration of demand. It represents a level where buyers are willing to enter the market in sufficient numbers to counteract selling pressure. In simple terms, it’s like a floor where the price tends to stop falling and may bounce back up.
- Resistance Level: Resistance level is a price level where an uptrend is expected to pause or reverse due to a concentration of supply. It represents a level where sellers are willing to enter the market in sufficient numbers to counteract buying pressure. In simple terms, it’s like a ceiling where the price tends to stop rising and may pull back down.
Trading strategy
- Bounce Trading: When the price approaches a support level, traders may buy expecting the price to bounce back up. Conversely, when the price approaches a resistance level, traders may sell expecting the price to bounce back down.
- Breakout Trading: When the price breaks through a support or resistance level, traders may enter positions in the direction of the breakout, expecting the price to continue moving in that direction.
- Pullback Trading: After a breakout occurs, traders may wait for a pullback to the broken support or resistance level before entering a trade in the direction of the breakout.
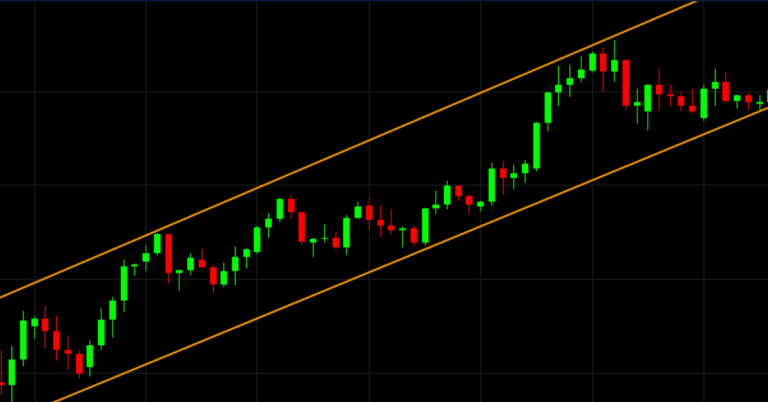
Trendline
Trendlines act as dynamic support or resistance levels depending on whether they are below (support) or above (resistance) the price.
- Uptrend Line: Connect successive higher lows. This line indicates the upward momentum in the price.
- Downtrend Line: Connect successive lower highs. This line indicates the downward momentum in the price.
- Breakouts occur when the price moves above a downtrend line or below an uptrend line, indicating a potential reversal or continuation of the trend.
- A breakout above a downtrend line or below an uptrend line can signal the potential start of a new uptrend or downtrend, respectively.
Remember that support and resistance levels are just one tool in a trader’s toolbox and should be used in conjunction with other technical indicators and fundamental analysis for making well-informed trading decisions. Use proper risk management techniques such as setting stop-loss orders to limit potential losses if the price fails to behave as expected after interacting with a trendline.