Stock volatility refers to the degree of variation in a trading price series over time. It’s a statistical measure that reflects the extent of price fluctuations in a stock or financial instrument. High volatility indicates larger price swings, while low volatility suggests smaller and more stable price movements.The term “52-week volatility” refers to the degree of variation or fluctuations in the price of a stock over the course of the past 52 weeks.
Standard Deviation
The most commonly used metric to measure stock volatility is standard deviation(σ). As mentioned earlier, standard deviation is a statistical measure of the dispersion of a set of values from their mean. In the context of stock prices, standard deviation is used to quantify the historical volatility of a stock. A higher standard deviation implies higher volatility.
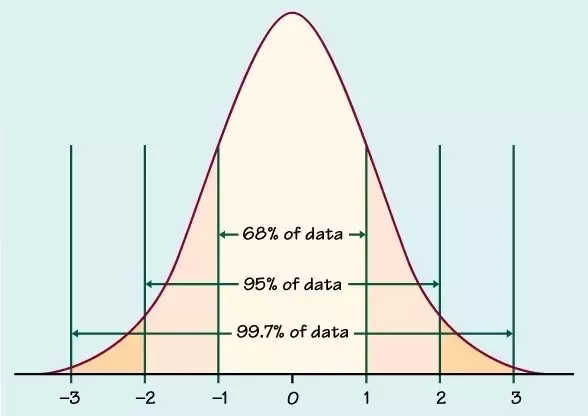
In a normal distribution, approximately 68% of the data falls within one standard deviation of the mean, 95% within two standard deviations, and 99.7% within three standard deviations. The distribution is symmetric, forming a bell-shaped curve.
Other Metrics to Measure Stock Volatility
Historical Volatility (HV): Historical volatility measures how much a stock’s price has deviated from its average price over a specified period. It is often calculated using the standard deviation of the stock’s past returns. Historical volatility provides a retrospective view of how volatile a stock has been.
Implied Volatility (IV): Implied volatility is derived from option prices and reflects the market’s expectations for future volatility. Traders use option pricing models (such as the Black-Scholes model) to calculate implied volatility. Elevated implied volatility often precedes significant market events or earnings announcements.
Beta: Beta measures a stock’s sensitivity to market movements. A beta of 1 indicates that the stock tends to move in line with the overall market. A beta greater than 1 suggests higher volatility than the market, while a beta less than 1 indicates lower volatility.
Average True Range (ATR): ATR is a technical indicator that measures market volatility by considering the range between a stock’s high and low prices. It provides an average range of price movements over a specified period, accounting for gaps and limit moves.
VIX (CBOE Volatility Index): Often referred to as the “fear index,” the VIX measures market expectations for future volatility. It reflects the market’s consensus on the anticipated volatility of the S&P 500 index over the next 30 days. A higher VIX is generally associated with increased market uncertainty.
Range Expansion Index (REI): REI is a volatility indicator that measures the percentage change in price over a specific period. It helps traders identify periods of increased volatility by comparing current price ranges to historical ranges.
Understanding and monitoring volatility is crucial for investors and traders. High volatility can present both opportunities and risks, as it may indicate potential profit opportunities but also higher uncertainty and the possibility of larger losses. Conversely, low volatility may suggest stability but could also lead to lower trading opportunities for certain strategies. Each volatility metric provides a different perspective on a stock’s price movements, and investors often use a combination of these metrics to make informed decisions.