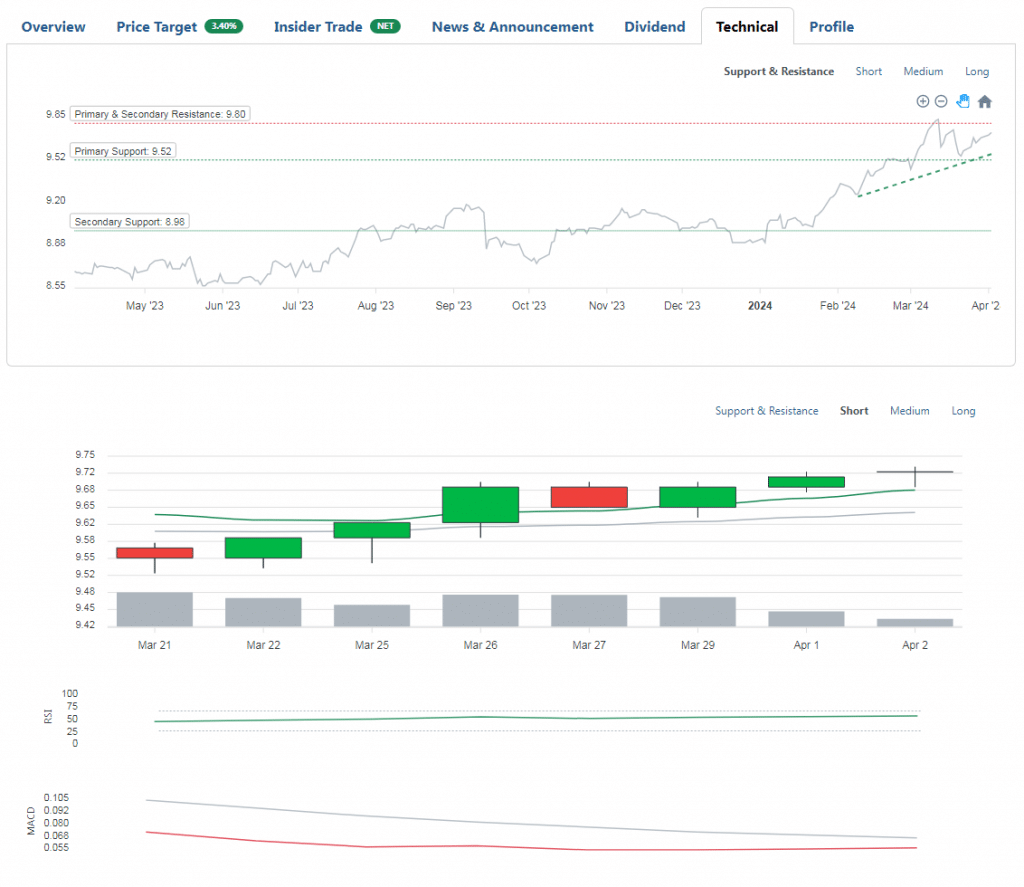
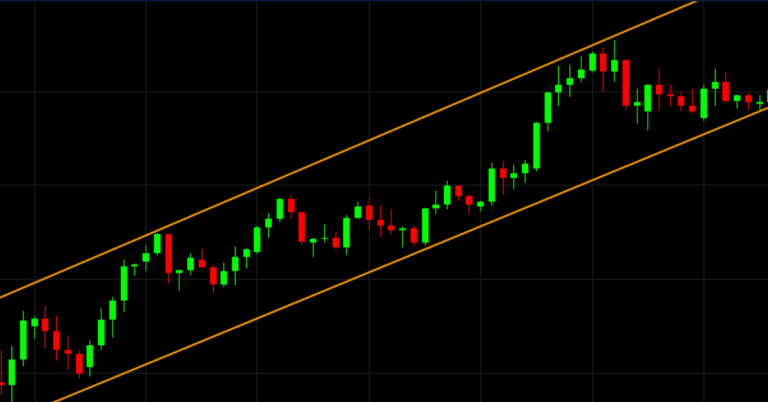
This update we release the technical tab on individual stock page. The difference between Stockmoo’s approach and our competition is automation. Stockmoo automatically generate the stock’s support, resistance level (both primary and secondary) and the trendline on the technical chart. This is powerful when combined with the watchlist filter as you can quickly identify stocks which fits your technical indicator requirements. As always, it’s best to use this as a headstart while at the same time verify the accuracy of the data provided. Read more on how to use support, resistance and trendline in your investment approach.


